California Wine Exports Reach All-Time High in 2013
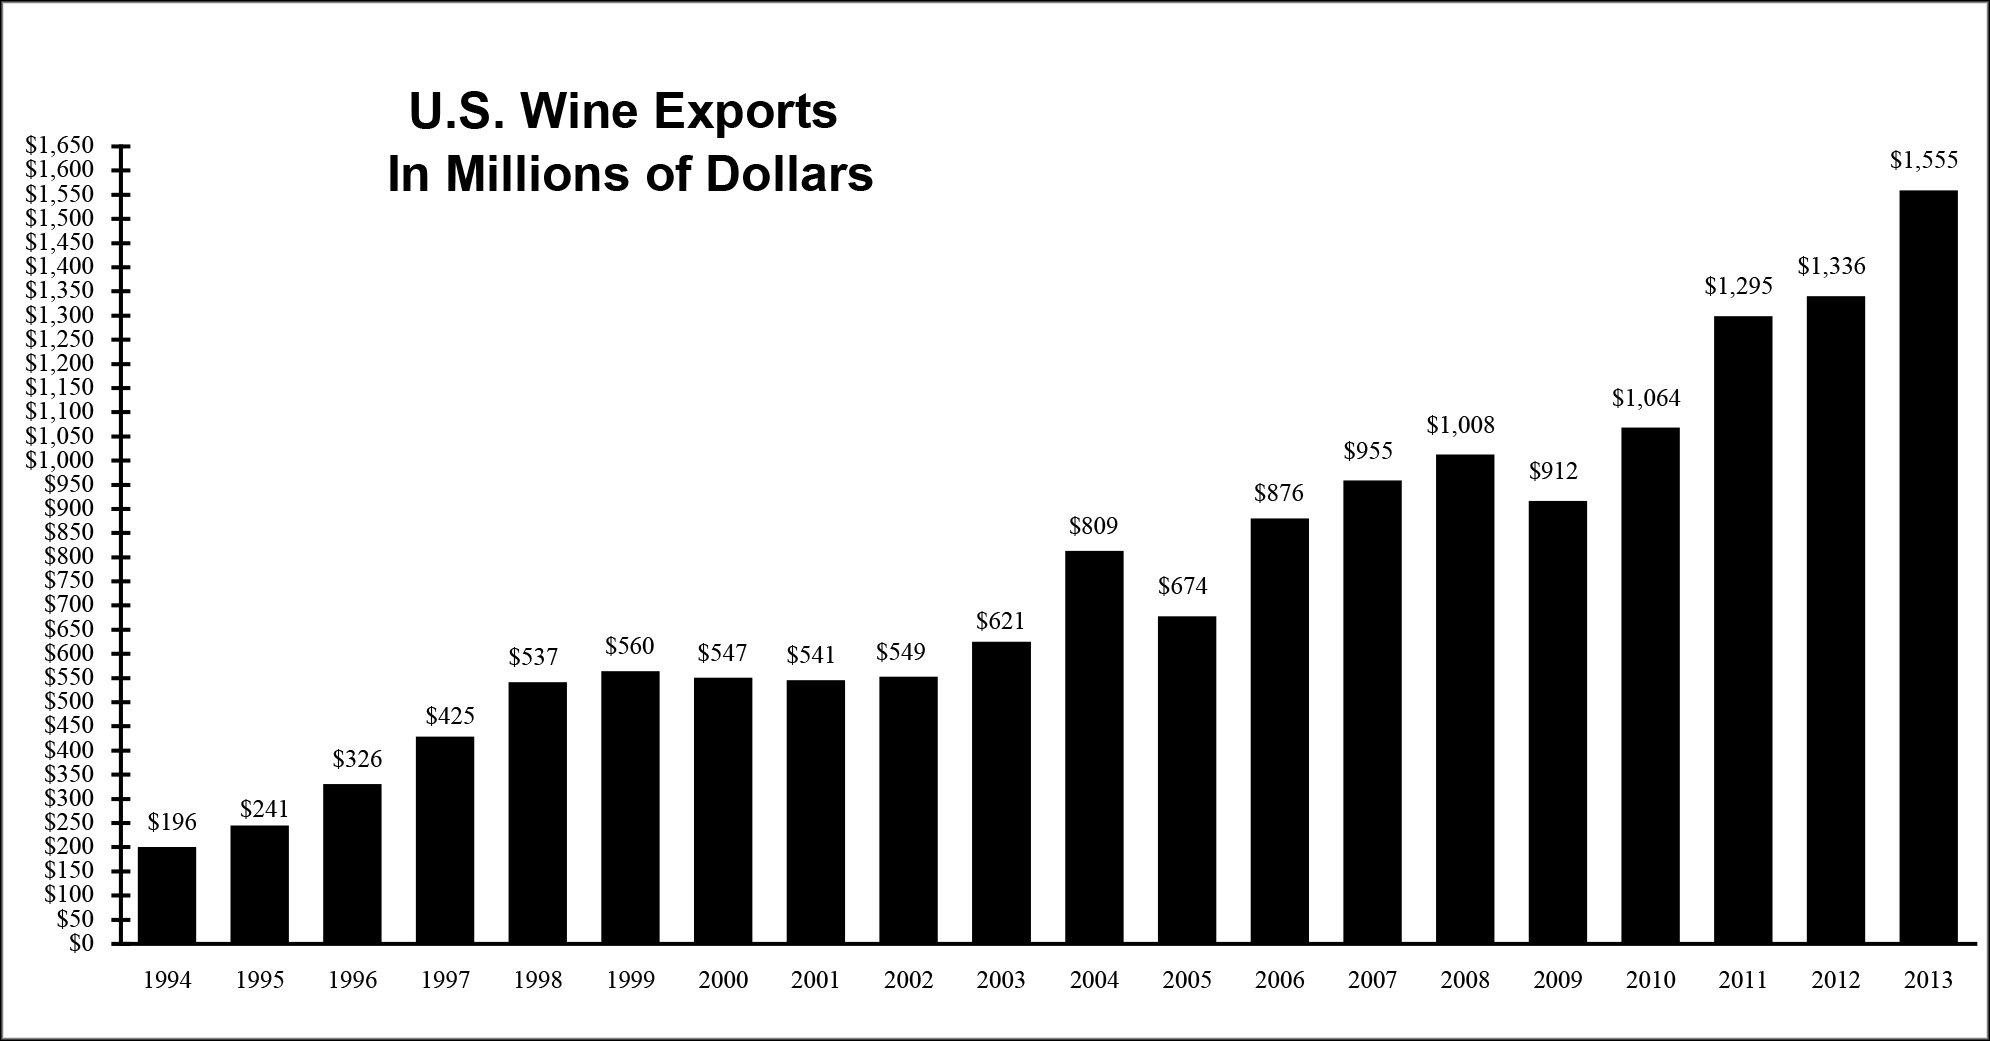
Details: SAN FRANCISCO — U.S. wine exports, 90% from California, reached a record high $1.55 billion in winery revenues in 2013, up 16.4% compared to the previous year, an increase for the fourth consecutive year by value. Volume shipments reached 435.2 million liters or 48.4 million cases, up 7.5%. "Consumers across the globe continue to recognize the quality, diversity and value of California wines, despite significant trade barriers and heavily subsidized foreign competitors," said Wine Institute President and CEO Robert P. (Bobby) Koch. "While the U.S. remains our largest, most important market, California exports a fifth of its wine, and we are on track to reach our goal of $2 billion in exports by 2020. Our outstanding 2012 and 2013 California vintages, heralded for quality as well as quantity, were a record high so we have the ability to expand." Of the top export markets for California Wines, the European Union's 28-member countries are the largest accounting for $617 million, up 31% compared to the previous year; followed by Canada, $454 million, up 12%; Japan, $102 million, down 7%; Hong Kong, $78 million, down 12%; China, $77 million, up 6%; Mexico, $22 million, up 21%; South Korea, $18 million, up 16%. "We have an aggressive global marketing campaign underway that communicates California as an aspirational place with beautiful landscapes, iconic lifestyle, great wine and food, and as an environmental leader," said Wine Institute Vice President International Marketing Linsey Gallagher. "Our activities in 25 countries convey these messages across the world through a full slate of activities including our global social media campaign and consumer website, www.discovercaliforniawines.com, which has been translated into Chinese and will soon be launched in seven other languages. Our programming in China has greatly expanded and allowed us to continue to show gains in that top priority market when our key competitors saw losses last year." "Wine Institute partners with the U.S. government to lower tariffs and eliminate unnecessary technical barriers in our key export markets. In particular, the Asia-Pacific Economic Cooperation 'Wine Regulators Forum' helps developing countries to implement science-based regulations and eliminate burdensome and duplicative regulations. This five-year project will help significantly reduce the costs of cross-border wine trade, stimulate demand and increase U.S. exports to this important region," said Tom LaFaille, Wine Institute Vice President and International Trade Counsel. Five of Wine Institute's 15 Regional Trade Directors reported on key markets as follows: Canada "California wine sales continued to outpace the overall wine market in Canada last year with strong sales in all regions of the country," according to Rick Slomka, Wine Institute Trade Director for Canada. "Much of the growth is a result of major retail promotions in the three largest provincial markets -- Quebec, Ontario and British Columbia as well as booming retail sales in Alberta. A strong Canadian dollar during 2013 enabled California vintners to invest significantly in marketing programs during the year as well as making California wines very price competitive compared to other imports. California wines are popular with both new and sophisticated wine consumers and across a wide range of price segments." Continental Europe "The renewed interest in California wines in Europe continued in 2013. A quarter of all California exports went to the European continent in 2013, up strongly from the 20% share in 2012. With very few exceptions, most markets posted solid gains," said Paul Molleman, Wine Institute Trade Director for Continental Europe. United Kingdom "The United Kingdom wine market has a long and productive relationship with California, and recent changes to the structure of the UK market have produced further opportunities for growth and development. Having a consistent and abundant supply of quality wine will enable us to maximize those opportunities," said Wine Institute United Kingdom Trade Director John McLaren. Japan "U.S. bulk wine exports to Japan have been growing as major Japanese importers are now importing popular-priced California wine brands in bulk and bottling in Japan. This reduces the burdensome import duty to a limited extent and makes inventory control easier. For bottled U.S. wine, Japan is now importing more expensive California wines than in the past. Unlike other New World wine exporting countries, California wine is well represented at high-end restaurants because of our successful annual restaurant promotion," said Ken-ichi Hori, Japan Trade Director for Wine Institute. "Once the Trans-Pacific Partnership free trade agreement is finalized, the import duty on U.S. wines will likely be minimized and help the entire California category increase in Japan." China and Emerging Markets "Asia's emerging wine markets remained a growth engine for California wines in 2013 despite the detrimental effects on sales resulting from China's new government austerity program. The value of California wine exports to China, our fifth largest export market worldwide, grew 6% in 2013, compared to the previous year. Other growth markets in Asia included South Korea, up 16% by value, which continued on its growth path following the successful completion of the U.S.–Korea Free Trade Agreement, and Singapore up 10%," said Eric Pope, Wine Institute's Regional Director, Emerging Markets. "In the America's, Mexico continued its multi-year resurgence with exports growing 21% by value and Brazil saw value gains of 26%." Since 1985, Wine Institute has served as the administrator of the Market Access Program, a cost-share export promotion program managed by the USDA's Foreign Agricultural Service. More than 150 wineries participate in Wine Institute's California Wine Export Program and export to 125 countries.
# # #
U.S. WINE EXPORTS 1994-2013 |
||||
Year |
Volume(In millions) |
Value(In millions of dollars) |
||
|
Gallons |
Liters |
Cases |
Revenues to Wineries |
|
|
2013* |
115.0 |
435.2 |
48.4 |
$1,555 |
|
2012* |
106.9 |
404.8 |
45 |
$1,336 |
|
2011* |
111.3 |
421.2 |
46.8 |
$1,295 |
|
2010* |
107.6 |
407.3 |
45.3 |
$1,064 |
|
2009 |
110.3 |
417.7 |
46.4 |
$912 |
|
2008 |
129.7 |
490.9 |
54.5 |
$1,008 |
|
2007 |
120.2 |
455.0 |
50.6 |
$955 |
|
2006 |
106.9 |
404.5 |
44.9 |
$876 |
|
2005 |
102.6 |
388.2 |
43.1 |
$674 |
|
2004 |
121.9 |
461.3 |
51.3 |
$809 |
|
2003 |
92.3 |
349.2 |
38.8 |
$621 |
|
2002 |
74.5 |
282.1 |
31.3 |
$549 |
|
2001 |
80.3 |
303.9 |
33.8 |
$541 |
|
2000 |
77.7 |
294.2 |
32.7 |
$547 |
|
1999 |
76.8 |
290.6 |
32.3 |
$560 |
|
1998 |
71.9 |
272.0 |
30.2 |
$537 |
|
1997 |
60.0 |
227.1 |
25.2 |
$425 |
|
1996 |
47.5 |
179.7 |
20.0 |
$326 |
|
1995 |
38.8 |
147.0 |
16.3 |
$241 |
|
1994 |
35.2 |
133.4 |
14.8 |
$196 |
|
U.S. WINE EXPORTS* Year to Date: January-December 2013 and 2012 |
|||||||
|
Value (U.S. Dollars) |
Variance ’13 v ’12 |
Volume (Liters) |
Variance ’13 v ’12 |
||||
|
PARTNER COUNTRY Ranked by 2013 Value |
2013 |
2012 |
Percent |
2013 |
2012 |
Percent |
|
| European Union Total** |
617,251,533 |
470,560,073 |
31.7 |
244,638,002 |
225,729,342 |
8.38 |
|
| Canada |
453,569,934 |
404,755,780 |
12.06 |
72,756,257 |
65,721,484 |
10.70 |
|
| Japan |
101,588,539 |
109,635,188 |
-7.34 |
29,425,475 |
29,653,027 |
-0.77 |
|
| Hong Kong |
77,563,646 |
88,314,110 |
-12.17 |
11,680,425 |
13,625,805 |
-14.28 |
|
| China |
77,206,981 |
73,014,089 |
5.74 |
17,855,934 |
17,652,257 |
1.15 |
|
| Mexico |
21,503,228 |
17,745,742 |
21.17 |
8,960,669 |
7,639,862 |
17.29 |
|
| South Korea |
18,315,543 |
15,842,598 |
15.61 |
4,414,312 |
3,997,640 |
10.42 |
|
| Switzerland |
17,081,503 |
11,794,974 |
44.82 |
3,899,206 |
4,278,273 |
-8.86 |
|
| Vietnam |
12,727,695 |
14,494,502 |
-12.19 |
1,726,207 |
960,133 |
79.79 |
|
| Singapore |
11,633,251 |
10,531,467 |
10.46 |
2,327,058 |
1,989,482 |
16.97 |
|
| Russia |
11,099,116 |
5,275,239 |
110.40 |
1,916,535 |
1,670,864 |
14.70 |
|
| Taiwan |
9,473,560 |
11,146,790 |
-15.01 |
1,744,847 |
2,151,606 |
-18.90 |
|
| Philippines |
9,109,755 |
7,719,227 |
18.01 |
3,141,483 |
2,812,089 |
11.71 |
|
| Dominican Republic |
9,044,647 |
5,040,755 |
79.43 |
2,181,448 |
1,591,811 |
37.04 |
|
| Nigeria |
8,090,653 |
4,102,631 |
97.21 |
2,296,197 |
1,326,415 |
73.11 |
|
| Bahamas |
6,720,830 |
7,499,597 |
-10.38 |
1,331,721 |
1,666,454 |
-20.09 |
|
| Panama |
6,475,058 |
3,853,729 |
68.02 |
1,770,191 |
1,210,965 |
46.18 |
|
| Thailand |
6,284,917 |
5,852,357 |
7.39 |
1,216,731 |
1,396,312 |
-12.86 |
|
| United Arab Emirates |
6,054,169 |
4,253,002 |
42.35 |
1,402,637 |
679,072 |
106.55 |
|
| Brazil |
4,258,332 |
3,390,835 |
25.58 |
1,398,720 |
1,084,781 |
28.94 |
|
| OTHER COUNTRIES |
69,452,306 |
60,797,213 |
14.24 |
19,151,636 |
17,961,722 |
6.62 |
|
| WORLD TOTAL |
1,554,505,196 |
1,335,619,898 |
16.39 |
435,235,691 |
404,799,396 |
7.52 |
|
# # #