California Chardonnay
Details: If Cabernet Sauvignon is the king of red grapes, Chardonnay is the queen of whites. The variety is California's most widely planted winegrape, with 93,452 acres reported in 2017. Chardonnay far and away remains the most popular wine in the U.S. and has continued to be the leading varietal wine for the last decade, with sales increases every year. Chardonnay represented an estimated 19 percent of table wine volume purchased in U.S. food stores in 2017, according to estimates by The Nielsen Company and Gomberg-Fredrikson & Associates. In 2017, California crushed 614,000 tons of Chardonnay. Fans of Chardonnay are familiar with the wine's classic descriptors: green apple, fig and citrus flavors, a complex aroma, and high acidity for a crisp wine. The wine is often aged in oak to produce toasty, vanilla and buttery overtones.
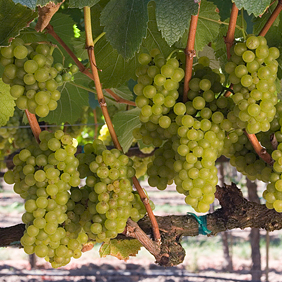
The Chardonnay Grape
Genetic studies have identified Chardonnay as a cross between Pinot Noir and Gouais Blanc. Historical references note California plantings of Chardonnay dating back to the late 1800s, but production remained limited because of the grape's low yields. Most Chardonnay vineyards were uprooted during Prohibition when growers replaced them with thick-skinned varieties that could be shipped cross country. Small plantings in the Livermore Valley and Santa Cruz Mountains survived Prohibition. It was not until the 1970s and thereafter that Chardonnay plantings boomed as the wine became increasingly popular.Top 10 California Counties for Chardonnay Acreage, 2017
| County | 2017 Total Acres |
|---|---|
| Monterey | 16,969 |
| Sonoma | 15,617 |
| San Joaquin | 13,148 |
| Napa | 6,914 |
| Santa Barbara | 5,658 |
| Madera | 5,420 |
| Yolo | 5,221 |
| Sacramento | 4,808 |
| Mendocino | 4,635 |
| San Luis Obispo | 2,930 |
| Other | 12,132 |
| STATE TOTAL | 93,452 |
Source: California Agricultural Statistics Service
California Chardonnay Grape Crush Tonnage
| Year | Tons Crushed |
|---|---|
| 2017 | 614,565 |
| 2016 | 675,885 |
| 2015 | 633,594 |
| 2014 | 718,029 |
| 2013 | 758,188 |
| 2012 | 735,775 |
| 2011 | 558,794 |
| 2010 | 656,297 |
| 2009 | 727,078 |
| 2008 | 566,306 |
| 2007 | 589,664 |
| 2006 | 549,502 |
| 2005 | 742,582 |
| 2004 | 568,295 |
| 2003 | 561,677 |
| 2002 | 594,746 |
| 2001 | 568,295 |
| 2000 | 650,524 |
| 1999 | 458,273 |
| 1998 | 428,827 |
| 1997 | 491,406 |
| 1996 | 304,463 |
| 1995 | 286,989 |