California Merlot
Details: Of California table wine shipments, Merlot is the third leading red varietal after Cabernet Sauvignon and Red Blends purchased by Americans today. California Merlot consumption held a 7% share of shipments in U.S. food stores in 2016, according to the Nielsen Company and Gomberg, Fredrikson & Associates estimates. What is the reason for Merlot's popularity? Industry observers offer possible explanations. Consumers continue to try red wine because of news reports linking moderate drinking to a healthy lifestyle. Also, white and blush drinkers may be expanding their preferences to red. Merlot may be the choice in both instances because of the soft, approachable and luscious character that is appealing to new and regular red wine drinkers. In restaurants, Merlot's average price is similar to the average price of the widely popular Chardonnay varietal.
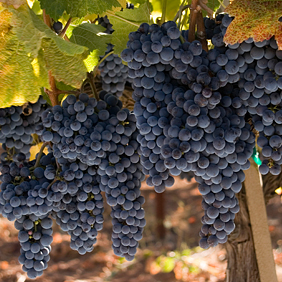
The Merlot Grape
Merlot is one of the principal winegrape varieties of the Bordeaux region in France, and was brought to California in the mid-19th century. Historically, vintners have used Merlot as a blending grape to soften a wine, usually with Cabernet Sauvignon. Merlot tannins are less forceful than Cabernet Sauvignon, so Merlot wine tends to mature earlier. Merlot is now primarily popular as a varietal wine. Most of the Merlot vines are planted in Lodi/San Joaquin County, followed by Napa Valley, Monterey, and Sonoma counties.Top California Counties for Merlot Acreage, 2016
| County | 2016 Total Acres |
|---|---|
| San Joaquin | 7,497 |
| Napa | 5,112 |
| Monterey | 4,997 |
| Sonoma | 4,948 |
| San Luis Obispo | 3,942 |
| Sacramento | 3,319 |
| Madera | 2,784 |
| Merced | 1,936 |
| Mendocino | 1,412 |
| Yolo | 758 |
| Other | 4,426 |
| STATE TOTAL | 41,131 |
Source: California Agricultural Statistics Service
California Merlot Grape Crush Tonnage
| Year | Tons Crushed |
|---|---|
| 2016 | 268,969 |
| 2015 | 252,889 |
| 2014 | 282,300 |
| 2013 | 346,149 |
| 2012 | 334,916 |
| 2011 | 286,340 |
| 2010 | 310,716 |
| 2009 | 326,356 |
| 2008 | 225,770 |
| 2007 | 304,078 |
| 2006 | 333,501 |
| 2005 | 423,776 |
| 2004 | 292,256 |
| 2003 | 261,085 |
| 2002 | 306,930 |
| 2001 | 273,397 |
| 2000 | 305,151 |
| 1999 | 239,567 |
| 1998 | 201,491 |
| 1997 | 201,707 |
| 1996 | 104,041 |
| 1995 | 73,666 |
| 1994 | 54,200 |
| 1993 | 40,996 |
| 1992 | 37,037 |
| 1991 | 26,493 |
| 1990 | 15,205 |